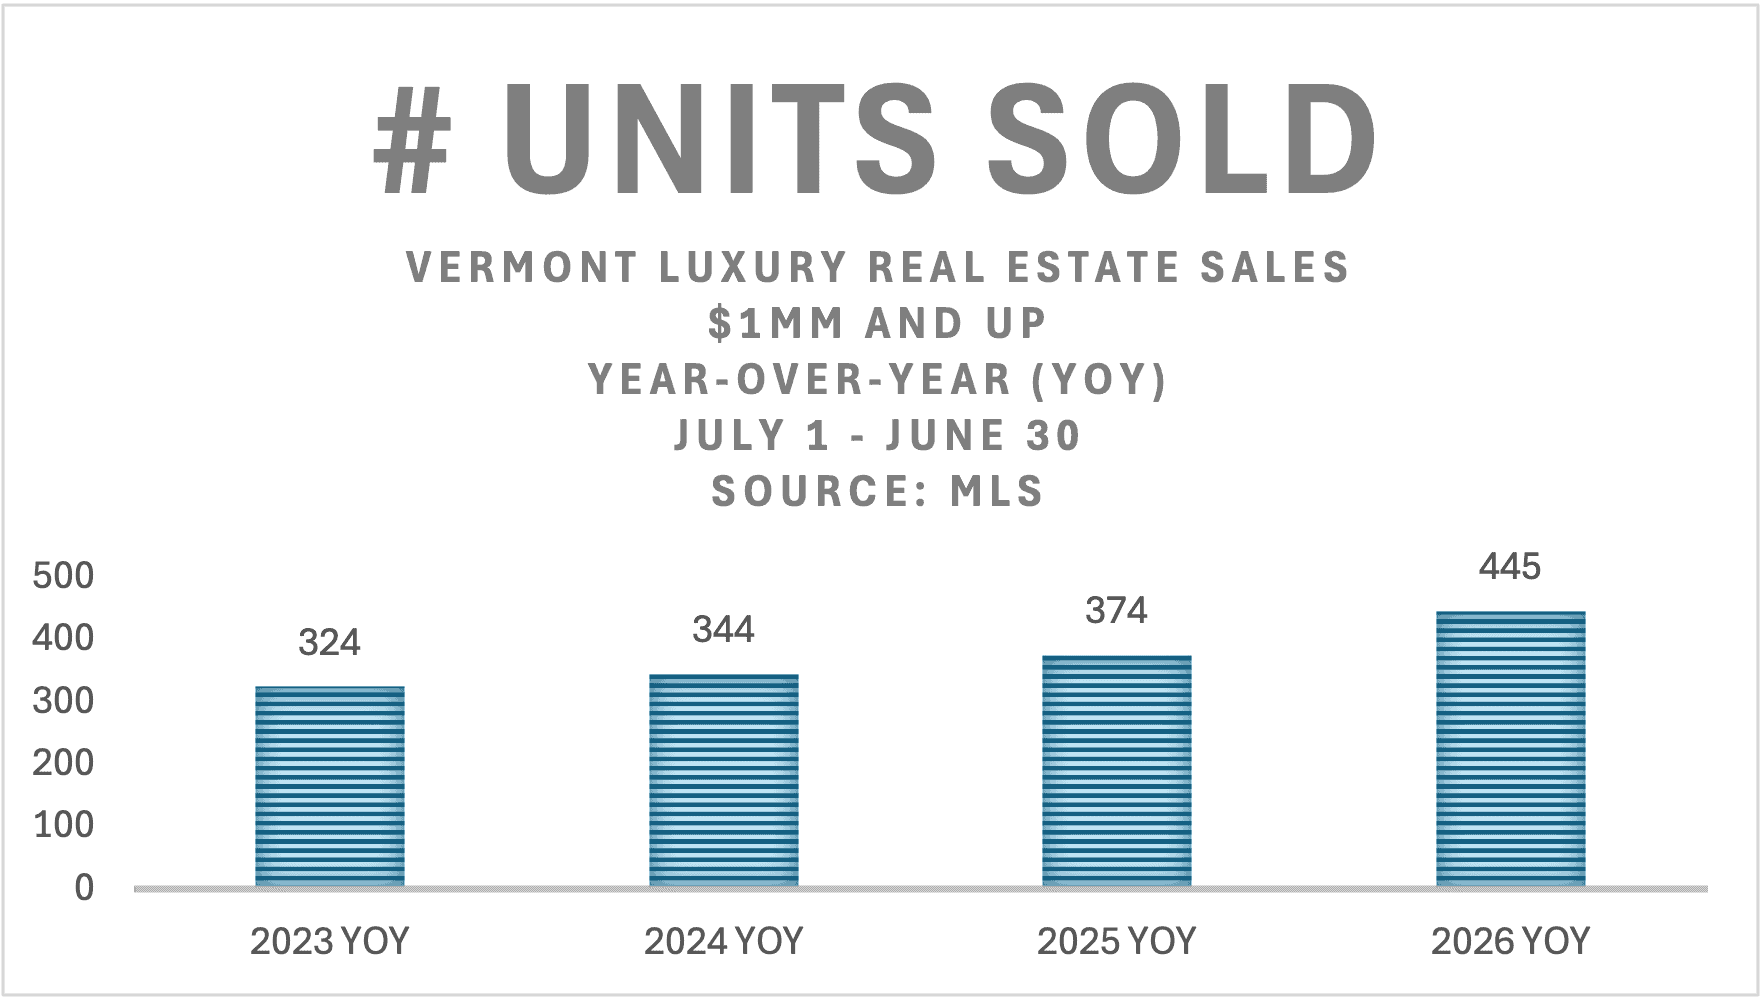
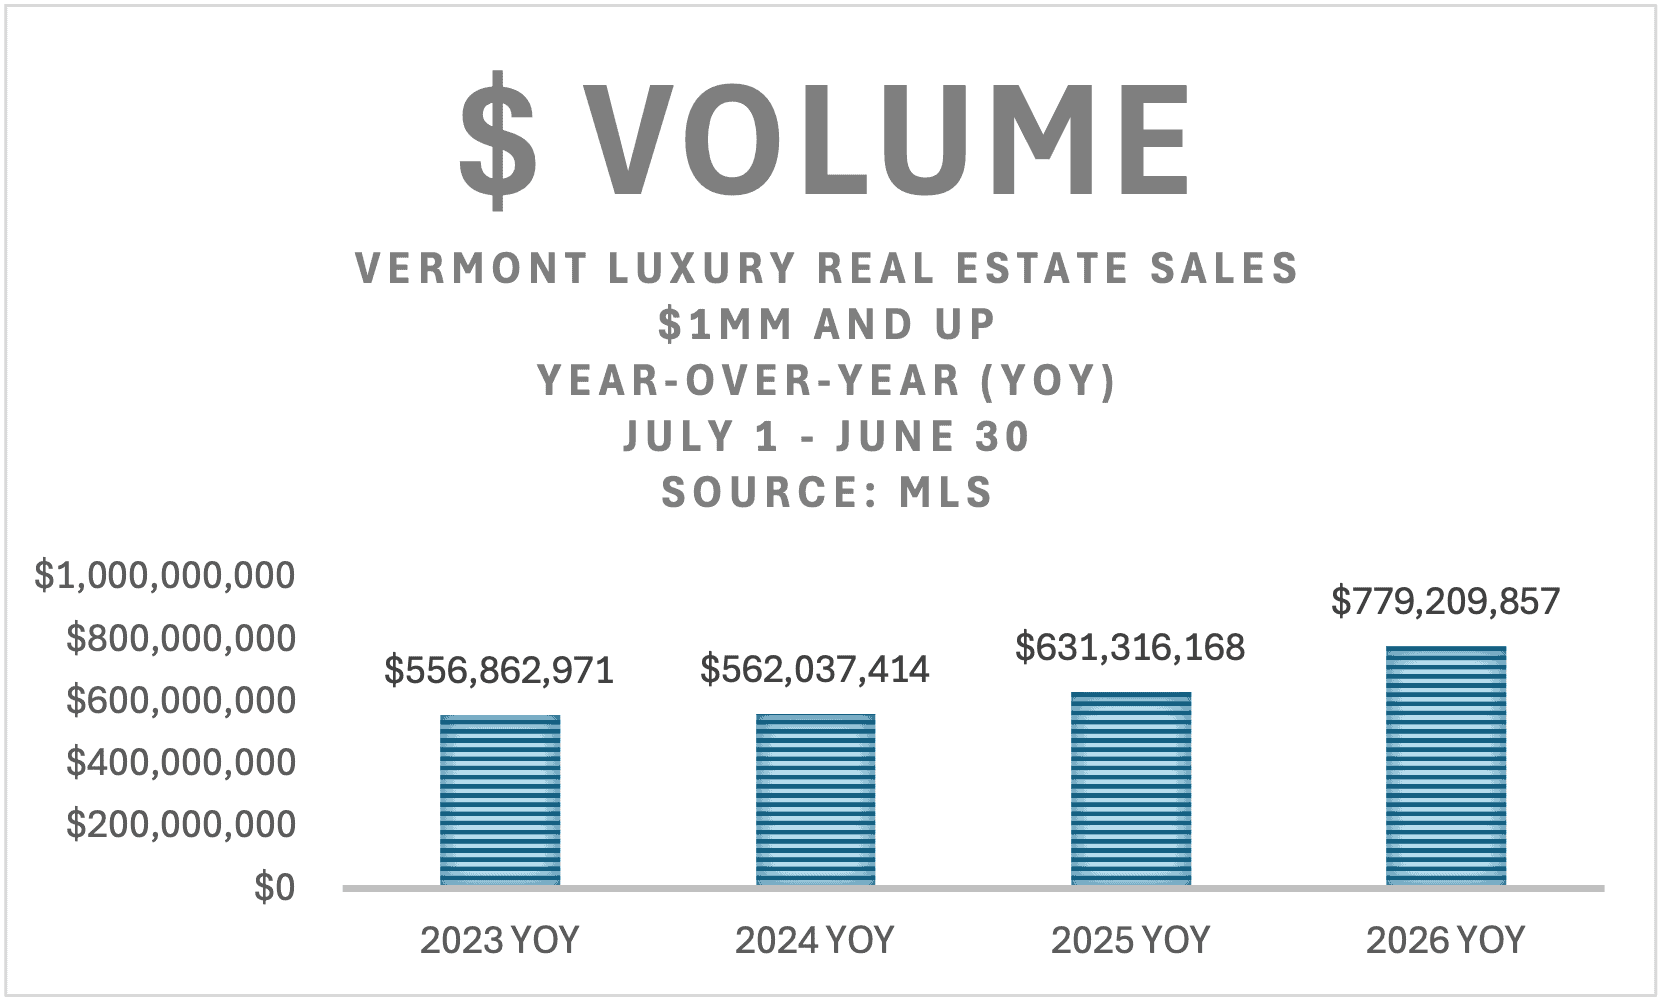
As we move into Vermont's midsummer market, residential sales over $1 million increased 19% year-over-year, while total dollar volume rose 23%.
At first glance, the increase in dollar volume might suggest that luxury home prices have risen significantly. However, dollar volume reflects both the number of homes sold and their selling prices.
Sales activity varied considerably by price range. Transactions between $1 million and $2 million increased 16%, while sales between $2 million and $3 million rose 29%. The $3 million-to-$4 million segment was essentially unchanged, while the largest percentage increases occurred above $4 million, where relatively few transactions can produce substantial swings in dollar volume.
Despite the increase in sales activity, pricing remained remarkably stable. The median sale price for homes over $1 million remained essentially unchanged, declining just 0.4% year-over-year, indicating that the increase in dollar volume was driven more by the number and mix of properties sold than by broad price appreciation.
The most significant change this year has been the increase in the number of properties actively listed above $1 million. A total of 351 properties were listed in June, 2026, compared with 201 during the same period in 2025—a 75% increase that has given buyers substantially more choice. Under different market conditions, that growth in supply might have resulted in softer sales. Instead, closed transactions also increased, an indication that buyer demand expanded alongside the growth in supply.
Confidence among buyers has also been supported by resilient equity markets, even amid ongoing economic and geopolitical uncertainty.
Days on market have changed very little, increasing from 77 days in 2025 to 79 days in 2026, further illustrating a market that remains resilient despite the increase in available inventory.
Market Wrap-Up
| Metric | 2025 | 2026 | Change |
| Unit Sales | 374 | 445 | 19% |
| Dollar Volume | $631M | $779M | 23% |
| Median Sale Price | $1.408M | $1.402M | -0.4% |
| Active Listings as 6/1 | 351 | 201 | 75% |
| Days on Market | 77 | 79 | +2 days |
What This Means
For sellers, consistent buyer demand continues to provide favorable opportunities, although competition has increased as inventory has expanded. Pricing, presentation, photography, and property condition have become more important than they were during the pandemic-driven seller's market. Homes that are thoughtfully prepared and strategically priced continue to generate the strongest interest, while those that miss the market initially often require price adjustments and longer marketing times.
For buyers, the market offers the greatest selection of luxury properties since before the pandemic, providing more opportunities to compare properties and make informed decisions. At the same time, the most desirable properties—those offering exceptional locations, privacy, views, architectural quality, or significant acreage—remain limited in supply and continue to attract strong interest.
Taken together, these indicators point to a market that is functioning in a healthy and predictable manner. Buyers have more opportunities than they did a year ago, while sellers continue to benefit from steady demand. Rather than being driven by rapid price appreciation or constrained inventory, today's market increasingly rewards thoughtful decision-making, realistic pricing, and careful property selection.
Questions about Vermont's Market? Feel free to reach out.
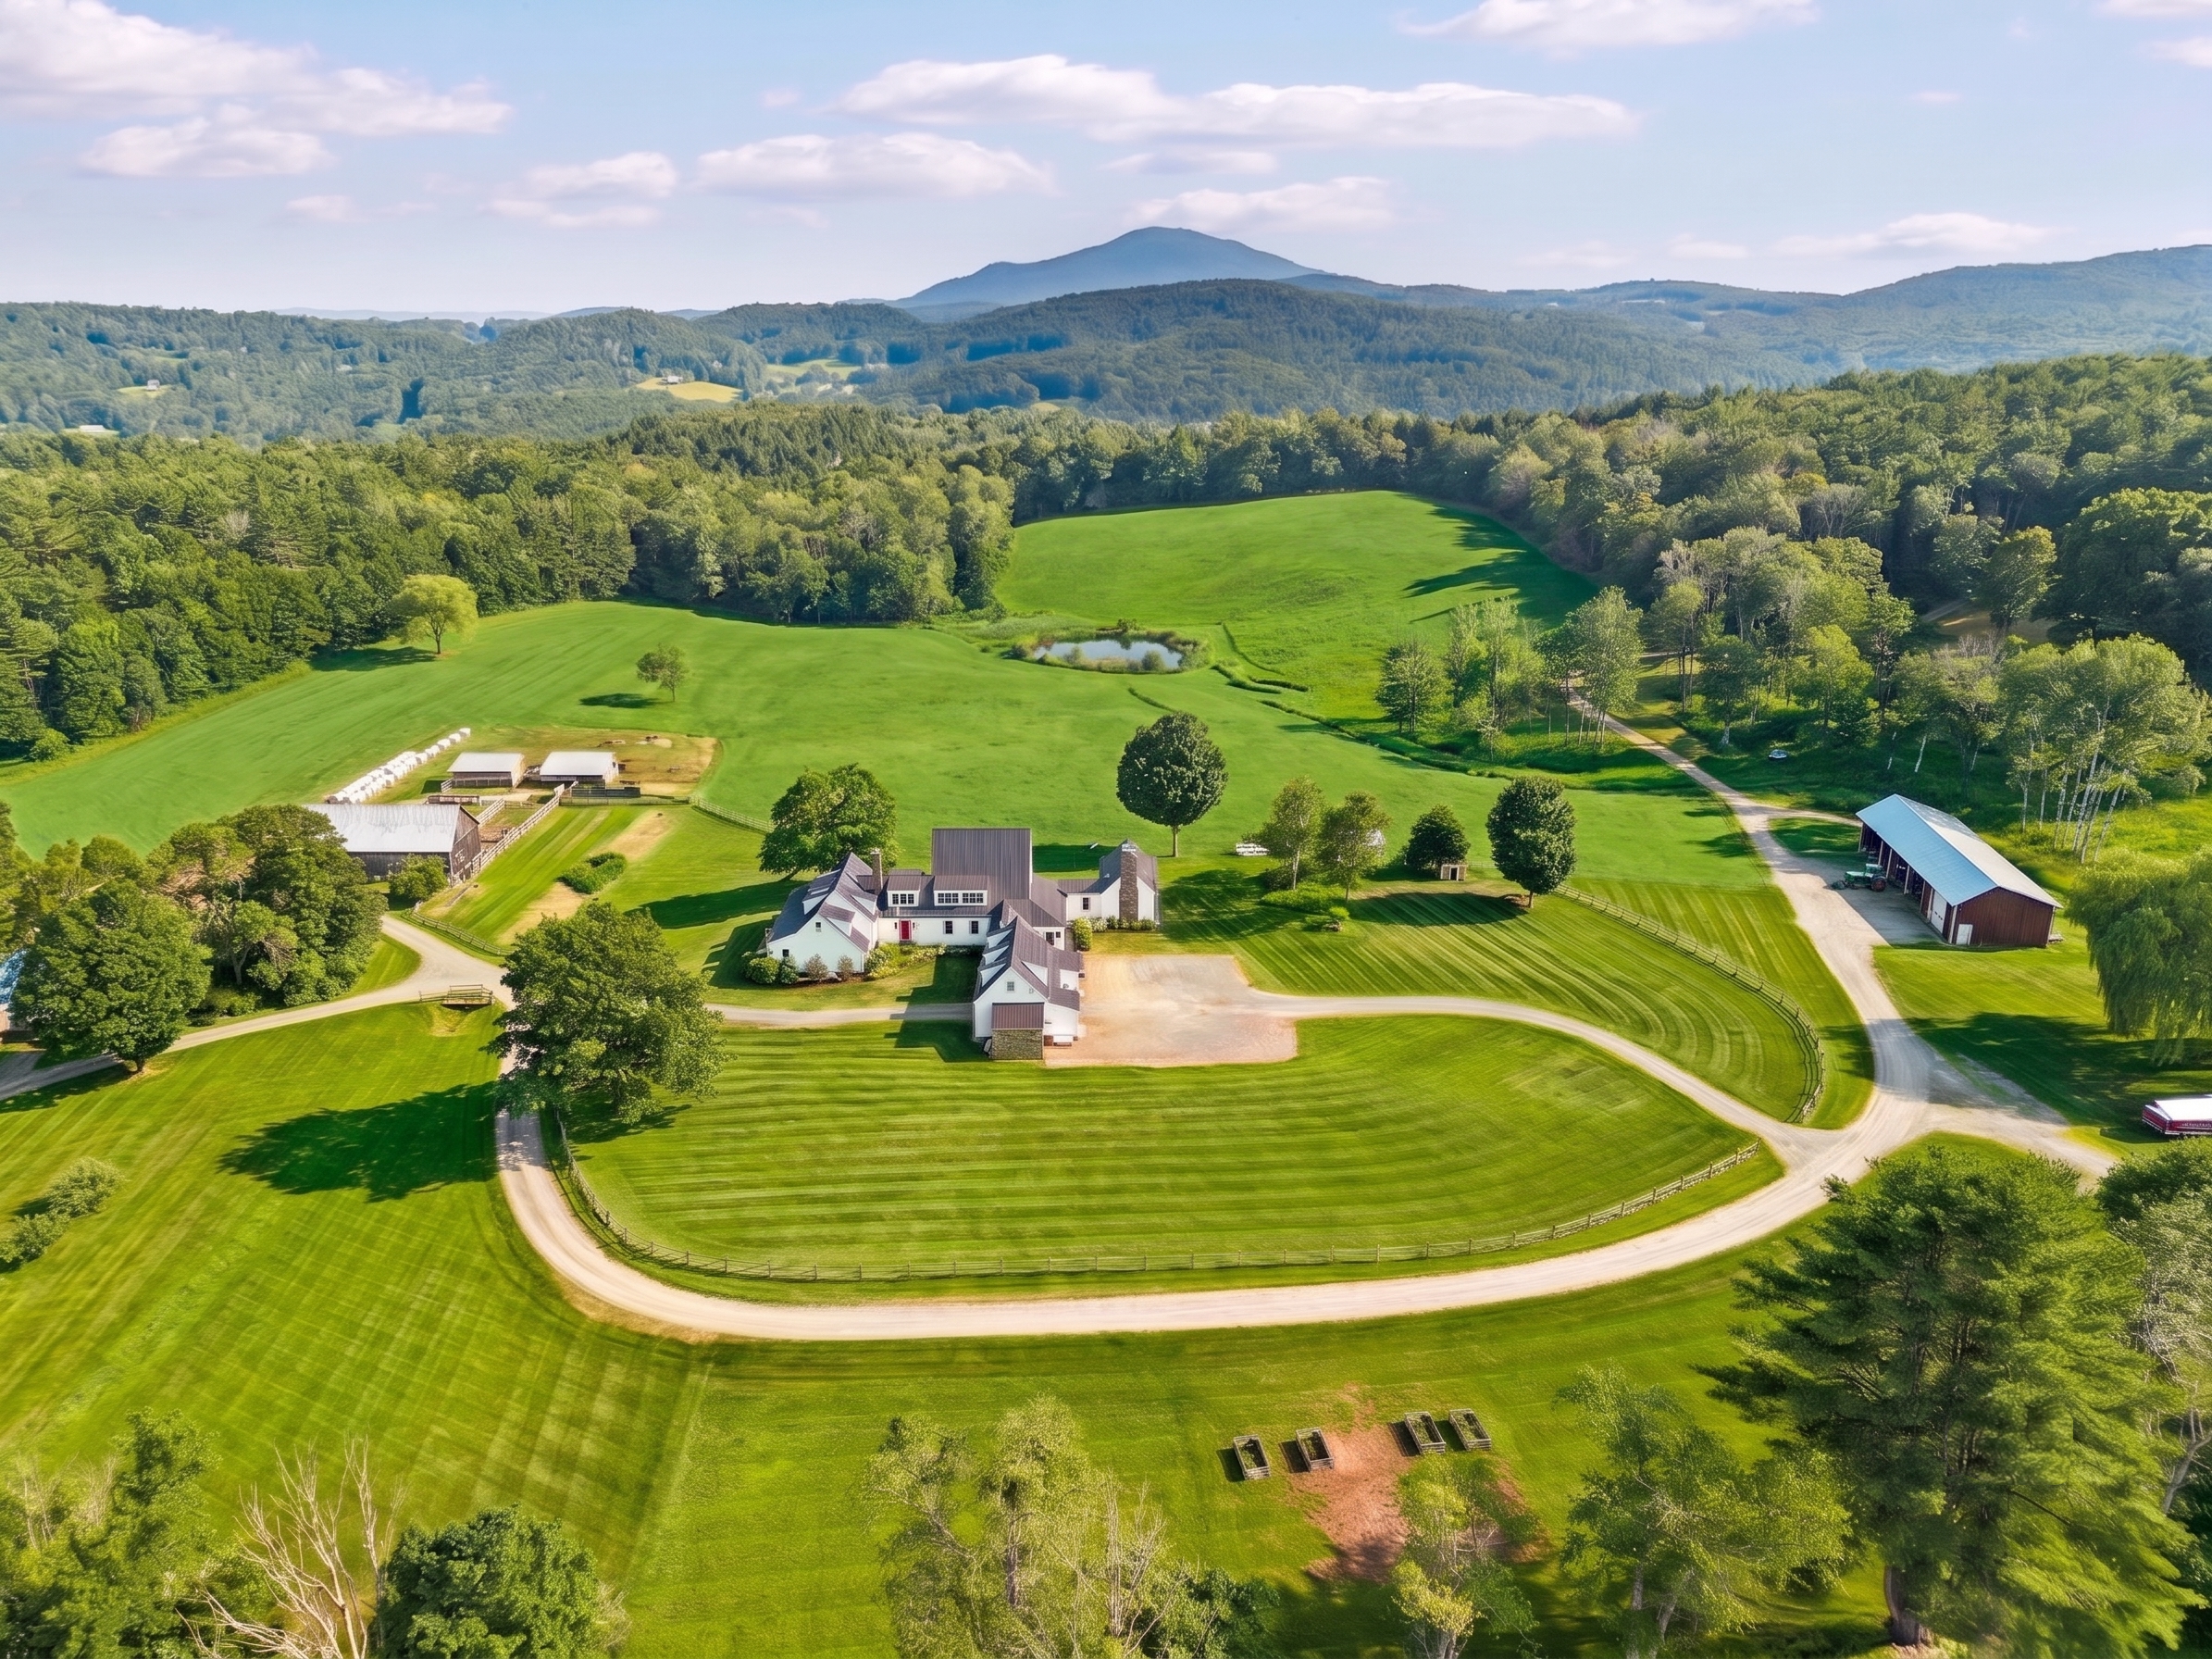 HARTLAND HILL FARM | HARTLAND, VERMONT



 To landvest.com




Follow Us on Social Media